
ھۆججەت:Expo02.svg

Size of this PNG preview of this SVG file: 500 × 500 پىكسېل. باشقا چوڭلۇقى: 240 × 240 پىكسېل | 480 × 480 پىكسېل | 768 × 768 پىكسېل | 1,024 × 1,024 پىكسېل | 2,048 × 2,048 پىكسېل.
ئەسلى ھۆججەت (SVG ھۆججىتى، ئاتاقتىكى چوڭلۇقى 500 × 500 نۇقتا، ھۆججەت چوڭلۇقى: 66 KB)
| چۈشەندۈرۈش |
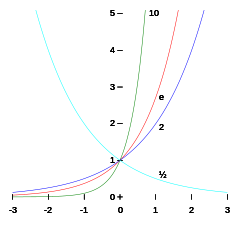
English: Graphs of y = bx for various bases b:
base 12.
Each curve passes through the point (0, 1) because any nonzero number raised to the power of 0 is 1. At x = 1, the value of y equals the base because any number raised to the power of 1 is the number itself. Automatic replacement for Image:Expo02.png: "A graph showing e^x (in red), 10^x (in green) and 1.7^x (in blue) over the x-interval -3 to 3." Created in wikipedia:Gnuplot. Gnuplot source code: set terminal svg size 315 304 fname "Verdana" fsize 12
set output "exp.svg"
set xrange [-3:3]
set yrange [-0.9:5.1]
set samples 500
set ticscale 0.5
set xtics axis 1
set ytics axis 1
set grid linewidth 0.1
unset key
unset border
set label 1 "e" at 1.1,exp(1)
set label 2 "10" at 0.8,10**0.7
set label 3 "2" at 1.1,1.9
set label 4 "½" at 1.1,0.6
plot exp(x) 1
plot 10**x 2
plot 2**x 3
plot 0.5**x 4
|
| مەنبە | ئۆز ئەسىرىم |
| يازغۇچى | User:EnEdC |
ئۈزۈندە
ئىجازەت
I, the copyright holder of this work, hereby publish it under the following licenses:

|
Permission is granted to copy, distribute and/or modify this document under the terms of the GNU Free Documentation License, Version 1.2 or any later version published by the Free Software Foundation; with no Invariant Sections, no Front-Cover Texts, and no Back-Cover Texts. A copy of the license is included in the section entitled GNU Free Documentation License. |
| This file is licensed under the Creative Commons Attribution-Share Alike 3.0 Unported license. | ||
| ||
| This licensing tag was added to this file as part of the GFDL licensing update. |
This file is licensed under the Creative Commons Attribution-Share Alike 2.5 Generic, 2.0 Generic and 1.0 Generic license.
- سىز ئەركىن:
- بەھىرلەش – to copy, distribute and transmit the work
- ئۆزگەرتىش – ئىجادىي ئەسەر
- تۆۋەندىكى شەرتلەرگە چوقۇم ئەمەل قىلىڭ:
- ئىمزا – You must give appropriate credit, provide a link to the license, and indicate if changes were made. You may do so in any reasonable manner, but not in any way that suggests the licensor endorses you or your use.
- ئوخشاش ئۇسۇلدا بەھىرلەش – If you remix, transform, or build upon the material, you must distribute your contributions under the same or compatible license as the original.
You may select the license of your choice.
ھۆججەت تارىخى
چېسلا/ۋاقىت چېكىلسە ئەينى ۋاقىتتا كۆرۈلگەن ھۆججەتنى كۆرسىتىدۇ.
| چېسلا/ۋاقىت | كىچىك سۈرەت | ئۆلچەم | ئىشلەتكۈچى | ئىزاھات | |
|---|---|---|---|---|---|
| نۆۋەتتىكى | 22:09, 27 سىنتەبىر 2010 | | 500 × 500 (66 KB) | Jalanpalmer | vacuum defs |
| 22:05, 27 سىنتەبىر 2010 |  | 500 × 500 (65 KB) | Jalanpalmer | Old version was way jaggy | |
| 21:39, 17 يانۋار 2007 |  | 315 × 304 (43 KB) | EnEdC | ||
| 21:32, 17 يانۋار 2007 |  | 315 × 304 (43 KB) | EnEdC | Self-made replacement for Image:Expo02.png: "A graph showing e^x (in red), 10^x (in green) and 1.7^x (in blue) over the x-interval -3 to 3." Created in en:Gnuplot. Category:Gnuplot diagrams |
ھۆججەت ئىشلىتىلىشى
تۆۋەندىكى بەت بۇ ھۆججەتنى ئىشلىتىدۇ:
ئورتاق ھۆججەت ئىشلىتىلىشى
تۆۋەندىكى باشقا ۋىكىلار بۇ ھۆججەتنى ئىشلىتىدۇ:
- ar.wikipedia.org دىكى ئىشلىتىشى
- ast.wikipedia.org دىكى ئىشلىتىشى
- bcl.wikipedia.org دىكى ئىشلىتىشى
- beta.wikiversity.org دىكى ئىشلىتىشى
- be.wikipedia.org دىكى ئىشلىتىشى
- bn.wikipedia.org دىكى ئىشلىتىشى
- bs.wikipedia.org دىكى ئىشلىتىشى
- ca.wikipedia.org دىكى ئىشلىتىشى
- ckb.wikipedia.org دىكى ئىشلىتىشى
- cy.wikipedia.org دىكى ئىشلىتىشى
- da.wikipedia.org دىكى ئىشلىتىشى
- de.wikipedia.org دىكى ئىشلىتىشى
- el.wikipedia.org دىكى ئىشلىتىشى
- en.wikipedia.org دىكى ئىشلىتىشى
- fa.wikipedia.org دىكى ئىشلىتىشى
- he.wikipedia.org دىكى ئىشلىتىشى
- hr.wikipedia.org دىكى ئىشلىتىشى
- hy.wikipedia.org دىكى ئىشلىتىشى
- id.wikipedia.org دىكى ئىشلىتىشى
- la.wikipedia.org دىكى ئىشلىتىشى
- lt.wikipedia.org دىكى ئىشلىتىشى
- no.wikipedia.org دىكى ئىشلىتىشى
- om.wikipedia.org دىكى ئىشلىتىشى
- pa.wikipedia.org دىكى ئىشلىتىشى
- ru.wikipedia.org دىكى ئىشلىتىشى
- sh.wikipedia.org دىكى ئىشلىتىشى
- sl.wikipedia.org دىكى ئىشلىتىشى
- sr.wikipedia.org دىكى ئىشلىتىشى
- ta.wikipedia.org دىكى ئىشلىتىشى
- th.wikipedia.org دىكى ئىشلىتىشى
- tl.wikipedia.org دىكى ئىشلىتىشى
- uk.wikipedia.org دىكى ئىشلىتىشى
- vi.wikipedia.org دىكى ئىشلىتىشى
- vi.wikibooks.org دىكى ئىشلىتىشى
- www.wikidata.org دىكى ئىشلىتىشى
- xal.wikipedia.org دىكى ئىشلىتىشى
- zh.wikipedia.org دىكى ئىشلىتىشى
- zh.wikibooks.org دىكى ئىشلىتىشى